install.packages("tidyverse")
install.packages("cowplot")1 Visualization
Statistics can be divided into two broad categories: descriptive statistics, which describe or summarise data, and inferential statistics, which allow us to infer something about a population from a sample.
This session focuses on descriptive statistics: how to appropriately display and summarise. You already know several techniques for displaying data (e.g., bar charts, histograms, scatter plots). When and how to use these techniques is one focus of today.
There are two critical purposes of data visualization:
- Getting a ‘gut’ feel for your data. Examining data graphically enables you to identify any outliers (suspicious observations which could be errors). It will also help you to select the most appropriate inferential statistical model (more on this later).
- Communicating your results. Focus on clarity, drawing attention to the most interesting aspects of your data. Graphics that are confusing, either through a lack of detail (e.g. no labels) or that contain too much information will fail in this central objective.
As you create graphics, keep in mind that they may be viewed on different machines, in grey scale, or by colour-blind or visually impaired readers. Colour scales such as those available from ColorBrewer or viridis are designed with this in mind.
1.1 R Review
We very briefly review key basics of R here. See R Basics for a more comprehensive review.
It’s best practice to load necessary packages at the top of your document. Remember, packages need to be installed once per machine, but loaded in each R session.
To install a package, either click the link in the yellow banner at the top of your script (RStudio usually does this when needed), or run:
You will likely not need to do that again this semester! However, you will need to use library(packageName) each time you open R.
1.2 Basic data exploration
1.2.1 Object structure
We will mostly work with dataframes. A data.frame is a 2D rectangular object with columns and rows. In a tidy dataset, each row represents an ‘observation’ and each column represents a ‘variable’. R (and often packages) contains several built-in dataframes, bundled into the datasets package which is automatically loaded.
Functions have arguments, which let you control their settings. They typically have defaults, which you can see in the help page. For example, head() shows the first 6 rows by default (?head: note n = 6L). Specify the argument to adjust the behaviour:
head(penguins, n=2) species island bill_len bill_dep flipper_len body_mass sex year
1 Adelie Torgersen 39.1 18.7 181 3750 male 2007
2 Adelie Torgersen 39.5 17.4 186 3800 female 2007tail(penguins, n=2) species island bill_len bill_dep flipper_len body_mass sex year
343 Chinstrap Dream 50.8 19.0 210 4100 male 2009
344 Chinstrap Dream 50.2 18.7 198 3775 female 2009# what are the last 10 rows?Function arguments do not need to be named if they are listed in the order given in the help documentation. For example, head(penguins, 2) will do exactly the same thing as head(x=penguins, n=2).
1.2.2 Subsetting, renaming, and rearranging
There are several ways to access subsets of a data.frame:
- Use
data_df$columnNameto extract a single column - Use
data_df[rows,columns]to extract a block
penguins$bill_len # whole columnpenguins[1, 3] # row 1, column 3[1] 39.1penguins[1:5, 3] # rows 1-5, column 3[1] 39.1 39.5 40.3 NA 36.7penguins[2:4, ] # leaving the 'columns' blank will return all columns species island bill_len bill_dep flipper_len body_mass sex year
2 Adelie Torgersen 39.5 17.4 186 3800 female 2007
3 Adelie Torgersen 40.3 18.0 195 3250 female 2007
4 Adelie Torgersen NA NA NA NA <NA> 2007We can also change column names. For illustration, let’s make a copy of the data.frame to do that.
penguins_alt <- penguins
names(penguins_alt)
[1] "species" "island" "bill_len" "bill_dep" "flipper_len"
[6] "body_mass" "sex" "year" [1] "species_name" "island" "bill_len" "bill_dep" "flipper_len"
[6] "body_mass" "sex" "year" Create a new column by specifying the name with df$colName and assigning a vector.
penguins_alt$bill_area <- penguins_alt$bill_dep * penguins_alt$bill_len
head(penguins_alt, 2)
species_name island bill_len bill_dep flipper_len body_mass sex year
1 Adelie Torgersen 39.1 18.7 181 3750 male 2007
2 Adelie Torgersen 39.5 17.4 186 3800 female 2007
bill_area
1 731.17
2 687.30Recall that you must assign the results of an operation (<-) to save it. For example, running penguins_alt[, 2:1] will display the results, but penguins_alt <- penguins_alt[, 2:1] will overwrite penguins_alt in your R environment.
You can also subset based on criteria. Say we only want rows with observations from 2009:
penguins_2009 <- penguins_alt[penguins_alt$year == 2009, ]It is always good to check that you’ve done what you think you’ve done:
nrow(penguins_2009) [1] 120head(penguins_2009, 2) species_name island bill_len bill_dep flipper_len body_mass sex year
101 Adelie Biscoe 35 17.9 192 3725 female 2009
102 Adelie Biscoe 41 20.0 203 4725 male 2009
bill_area
101 626.5
102 820.0count(penguins_alt, year) year n
1 2007 110
2 2008 114
3 2009 120count(penguins_2009, year) year n
1 2009 1201.2.3 NAs and summary
When you import data, you should check for missing values. These are represented as NA.
We can check each element of a vector using is.na(), which will return TRUE if an element is NA, and FALSE if an element is not NA.
is.na(penguins_alt$sex)R converts logical values (i.e., TRUE/FALSE) to numeric (i.e., 1/0) automatically, allowing convenient summaries:
[1] 11[1] 0.03197674Another very useful check is summary():
summary(penguins_alt) species_name island bill_len bill_dep
Adelie :152 Biscoe :168 Min. :32.10 Min. :13.10
Chinstrap: 68 Dream :124 1st Qu.:39.23 1st Qu.:15.60
Gentoo :124 Torgersen: 52 Median :44.45 Median :17.30
Mean :43.92 Mean :17.15
3rd Qu.:48.50 3rd Qu.:18.70
Max. :59.60 Max. :21.50
NA's :2 NA's :2
flipper_len body_mass sex year bill_area
Min. :172.0 Min. :2700 female:165 Min. :2007 Min. : 497.6
1st Qu.:190.0 1st Qu.:3550 male :168 1st Qu.:2007 1st Qu.: 667.7
Median :197.0 Median :4050 NA's : 11 Median :2008 Median : 730.8
Mean :200.9 Mean :4202 Mean :2008 Mean : 750.8
3rd Qu.:213.0 3rd Qu.:4750 3rd Qu.:2009 3rd Qu.: 807.2
Max. :231.0 Max. :6300 Max. :2009 Max. :1127.4
NA's :2 NA's :2 NA's :2 summary(penguins_alt)Once you are confident that your data.frame looks sensible, that it contains the data you expect, and that the data types are correct, you can start to explore and summarise your data.
There are many graphical methods for data exploration. The appropriate method depends on the nature of the data and what you wish to communicate to the reader.
1.3 Graphical methods for displaying data
Always keep in mind that the primary reason for data visualization is to communicate concisely and accurately to your reader. Graphics should be clear, concise and easy to understand.
Real data is usually complex, and creating effective figures takes careful thought and often many revisions.
We will primarily use the ggplot2 package because it is more straightforward in many ways. It loads when you run library(tidyverse). However, we will also note equivalent base R functions from time to time.
1.3.1 Scatter plots
Scatter plots display two continuous variables against each other. They are commonly used for analyses like correlation or linear regression.
With ggplot2:
ggplot(penguins_alt, aes(x=body_mass, y=bill_len)) +
  geom_point() +
  labs(x="Body mass (g)",
       y="Bill length (mm)",
       title="Bill length increases with body mass")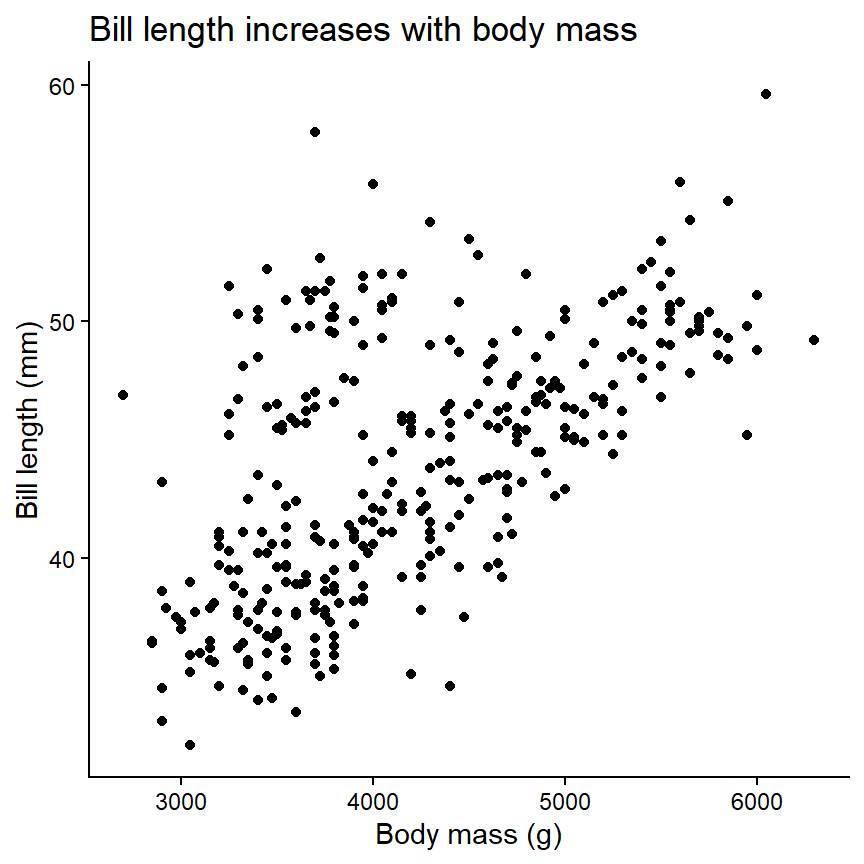
The ggplot() function takes the dataframe as the first argument. The plot aesthetics are specified with aes(), such that variables (=columns) are mapped to plot aesthetics. Then, layers are added using geom_*(). Additional functions can be ‘added’ to further modify the plot. See a comprehensive list in the ggplot2 manual.
Once you understand the basic structure, it becomes easy to create more interesting figures:
ggplot(penguins_alt, aes(x=body_mass, y=bill_len, colour=species_name)) +
  geom_point() +
  geom_line(stat="smooth", method="lm") +
  scale_colour_brewer("Species", palette="Dark2") +
  labs(x="Body mass (g)",
       y="Bill length (mm)",
       title="Bill length increases with body mass")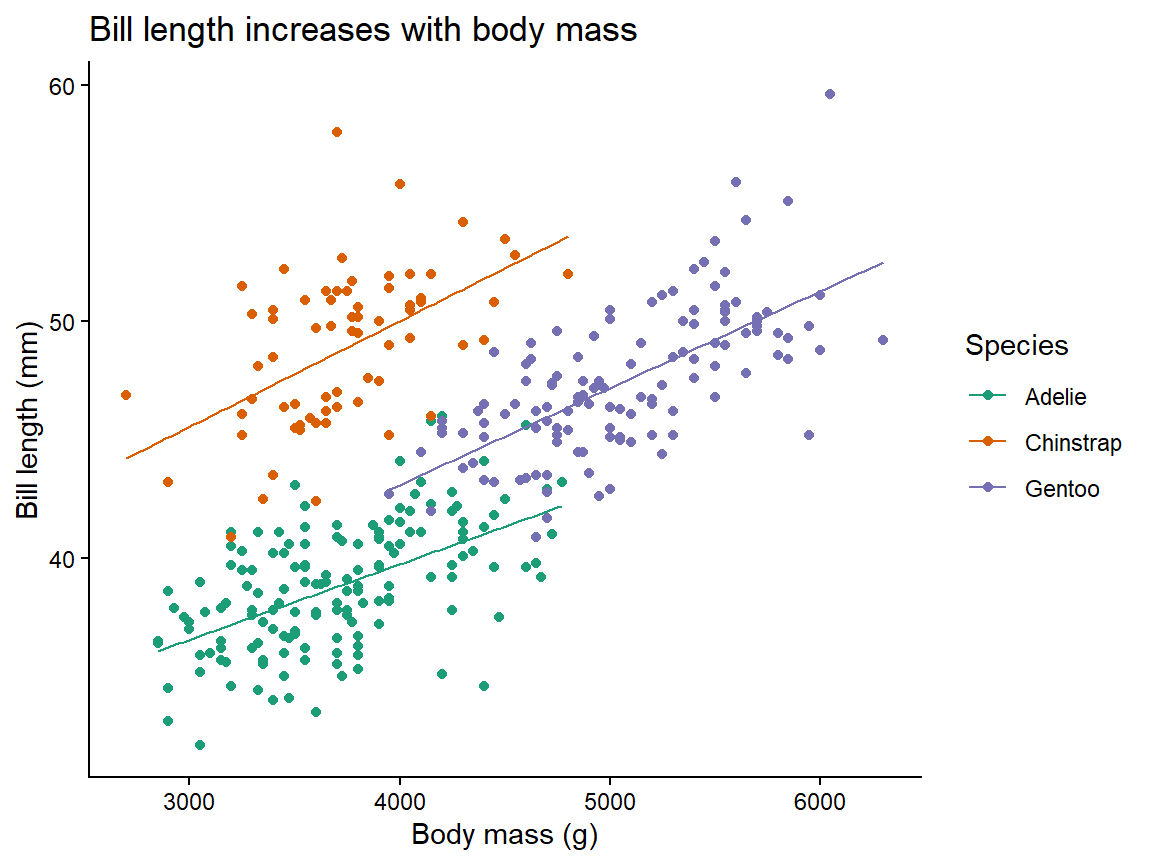
With base R, the plot() function will create a scatter plot if given two numeric variables. There are two options for specifying the variables.
Using data_df with columns x and y, the same plot can be created with either syntax:
data_df <- data.frame(x=1:3, y=4:6)
plot(data_df$x, data_df$y) # two vectors: x, y
plot(y ~ x, data=data_df) # columns in dataframe: formula y ~ x
There are many options for modifying the output of plot(), but it is clunkier compared to ggplot2.
Q. 1.1
With the
penguins dataset, plot bill length by body mass for only Chinstrap penguins. Make sure the plot is fully labelled.
TipView solution
ggplot(penguins[penguins$species=="Chinstrap",], aes(body_mass, bill_len)) +
  geom_point() +
  labs(x="Body mass (g)",
       y="Bill length (mm)",
       title="Chinstrap penguins")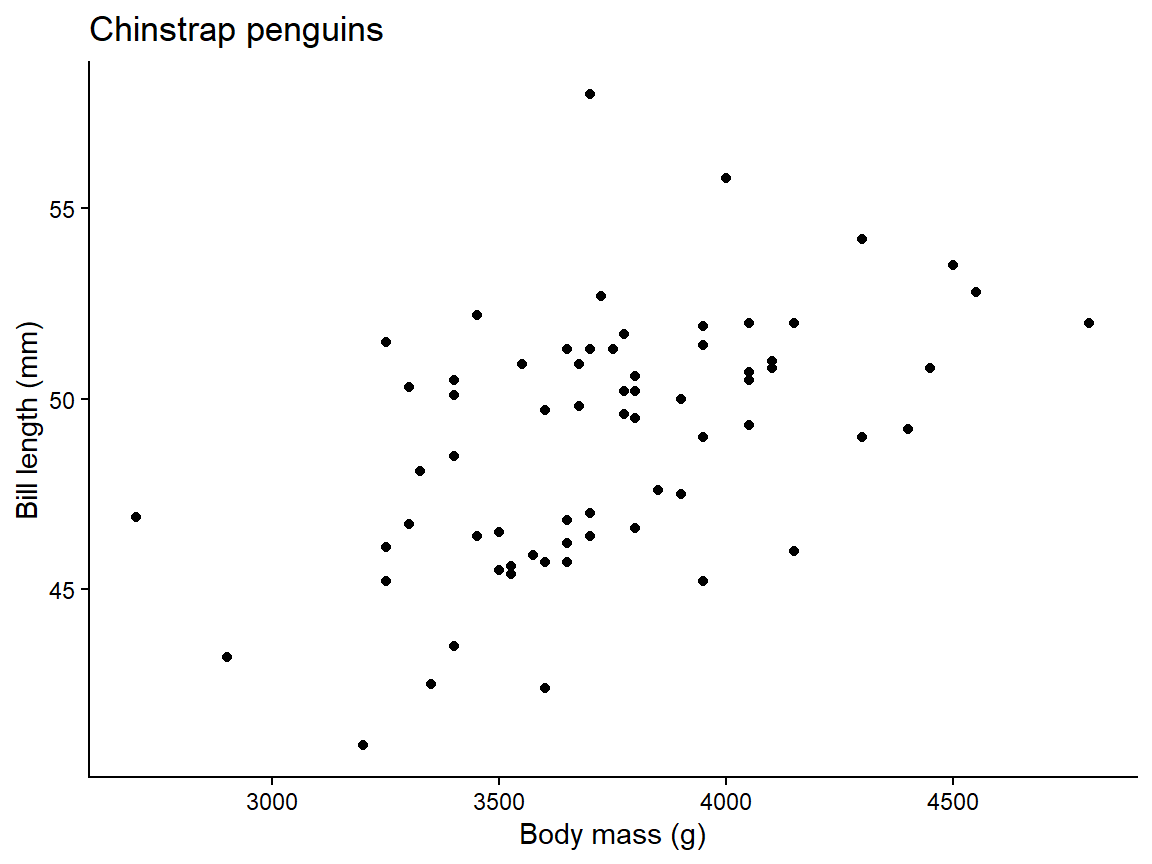
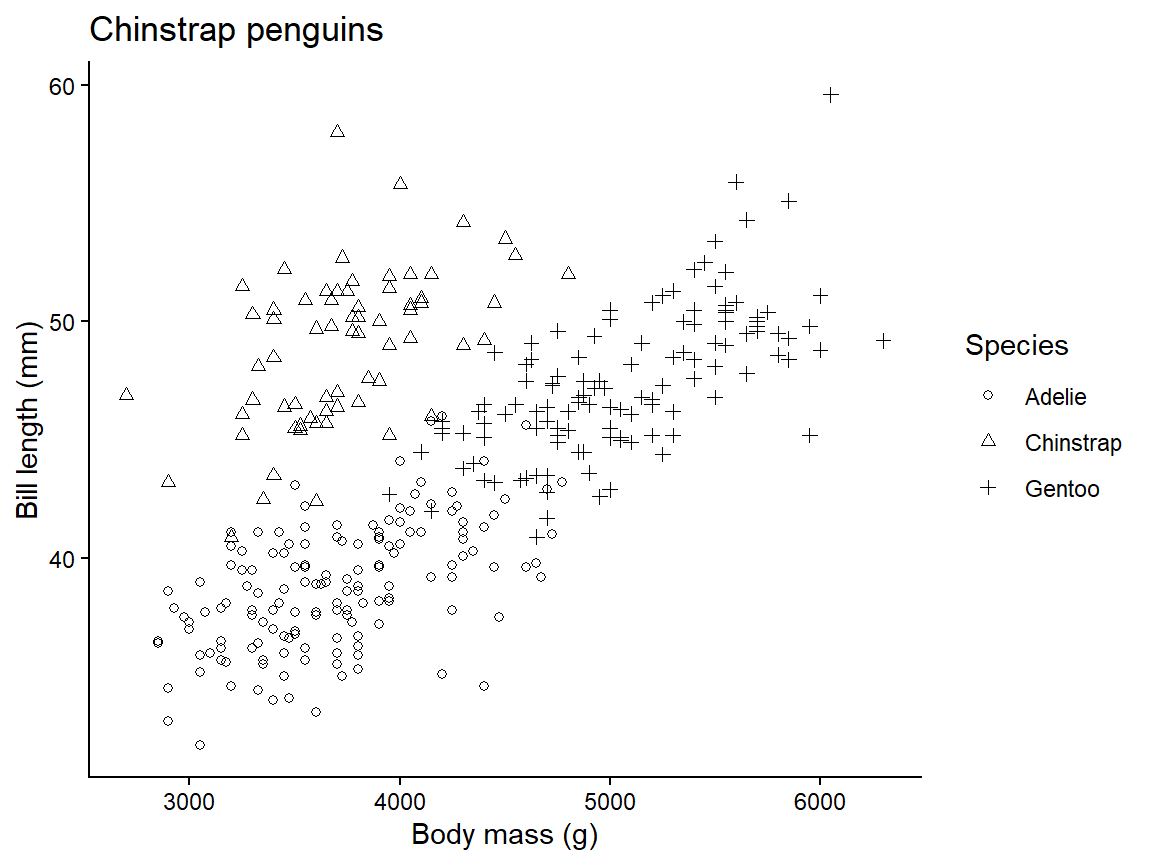
Q. 1.2
Using
ggplot(), create a figure where each species is a different shape. See the Aesthetics section in ?geom_point for help.
1.3.2 Boxplots
Box plots are used to summarise a continuous variable by levels of a factor.
Explore the data.frame using the strategies covered above. Which variables are categorical? Which are continuous?
'data.frame':   344 obs. of  8 variables:
 $ species    : Factor w/ 3 levels "Adelie","Chinstrap",..: 1 1 1 1 1 1 1 1 1 1 ...
 $ island     : Factor w/ 3 levels "Biscoe","Dream",..: 3 3 3 3 3 3 3 3 3 3 ...
 $ bill_len   : num  39.1 39.5 40.3 NA 36.7 39.3 38.9 39.2 34.1 42 ...
 $ bill_dep   : num  18.7 17.4 18 NA 19.3 20.6 17.8 19.6 18.1 20.2 ...
 $ flipper_len: int  181 186 195 NA 193 190 181 195 193 190 ...
 $ body_mass  : int  3750 3800 3250 NA 3450 3650 3625 4675 3475 4250 ...
 $ sex        : Factor w/ 2 levels "female","male": 2 1 1 NA 1 2 1 2 NA NA ...
 $ year       : int  2007 2007 2007 2007 2007 2007 2007 2007 2007 2007 ...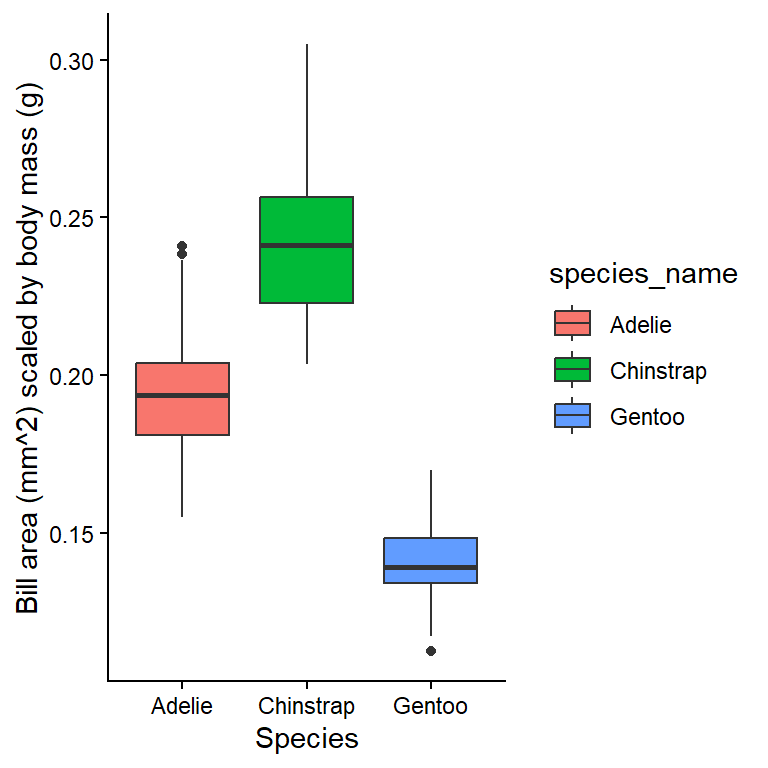
?geom_boxplot
# See examples at bottom of the help page
Q. 1.3
Reproduce the plot shown in Figure 1.3.
TipView solution
ggplot(penguins_alt, aes(species_name, bill_area/body_mass, fill=species_name)) +
  geom_boxplot() +
  labs(x="Species",
       y="Bill area (mm^2) scaled by body mass (g)")
Q. 1.4
Use
?boxplot.stats to investigate what the box and whiskers actually represent.
In base R, use boxplot(y ~ x, data=dataframe) to create a boxplot.
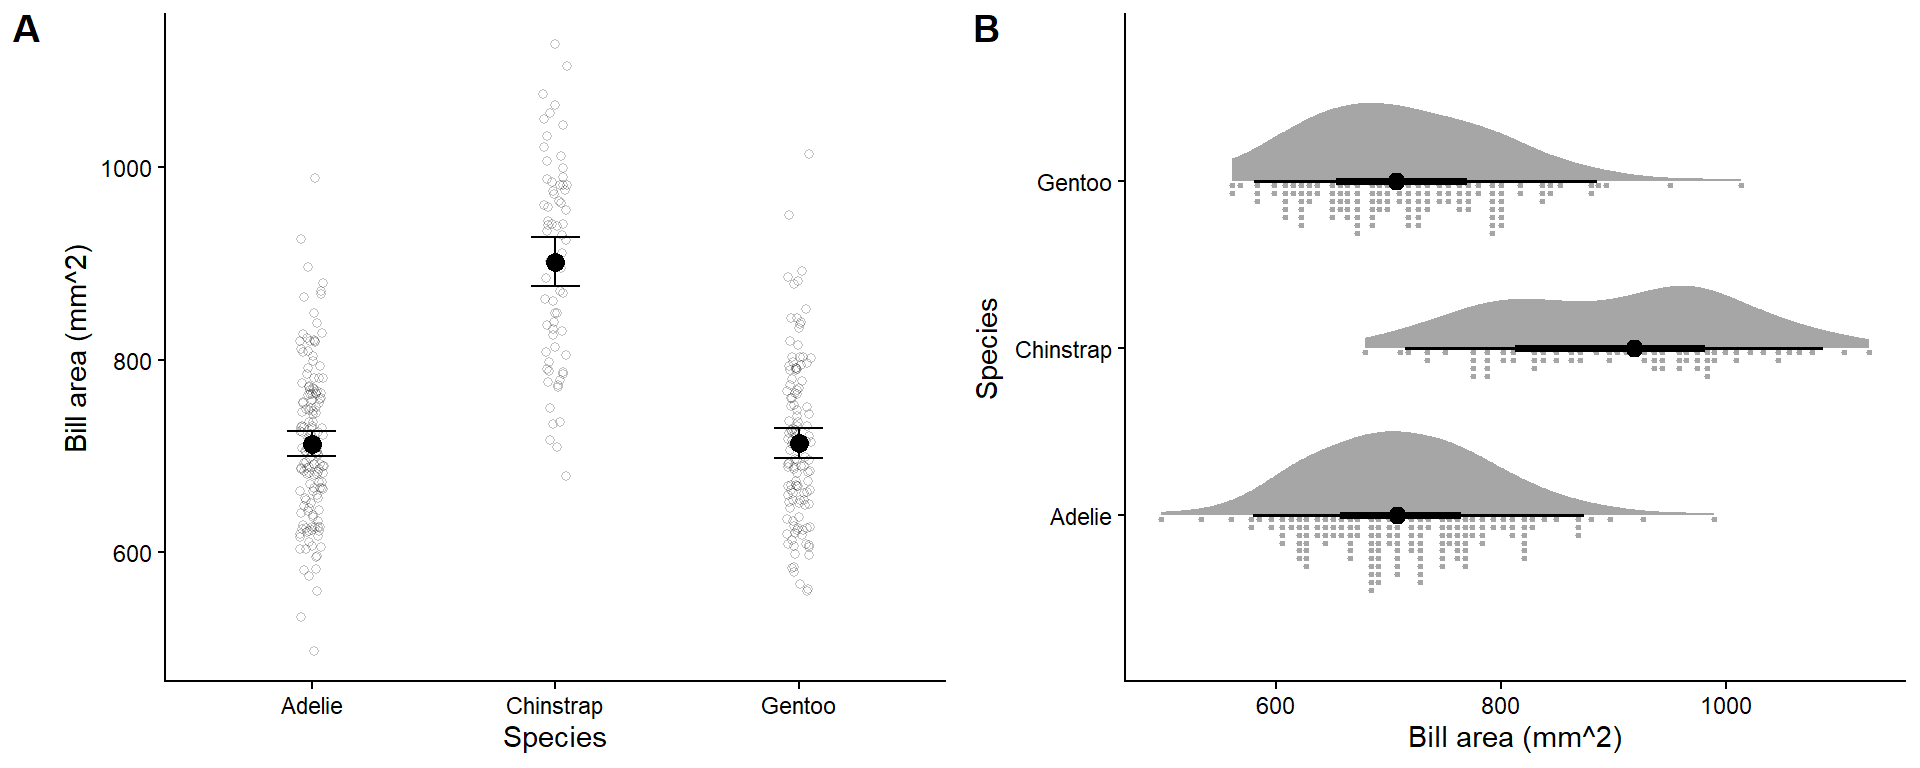
Note that box plots are not the most visually intuitive, since smaller box areas correspond with more observations. Packages like ggplot2 (and extensions) make alternatives like those in Figure 1.4 simple to produce. We will cover some of these later.
1.3.3 Line plots
Line plots are most often seen in timeseries plots with time on the x-axis and the response on the y-axis. Line plots involve joining points with a line, which indicates that you have made assumptions about the value of the response variable between successive measurements.
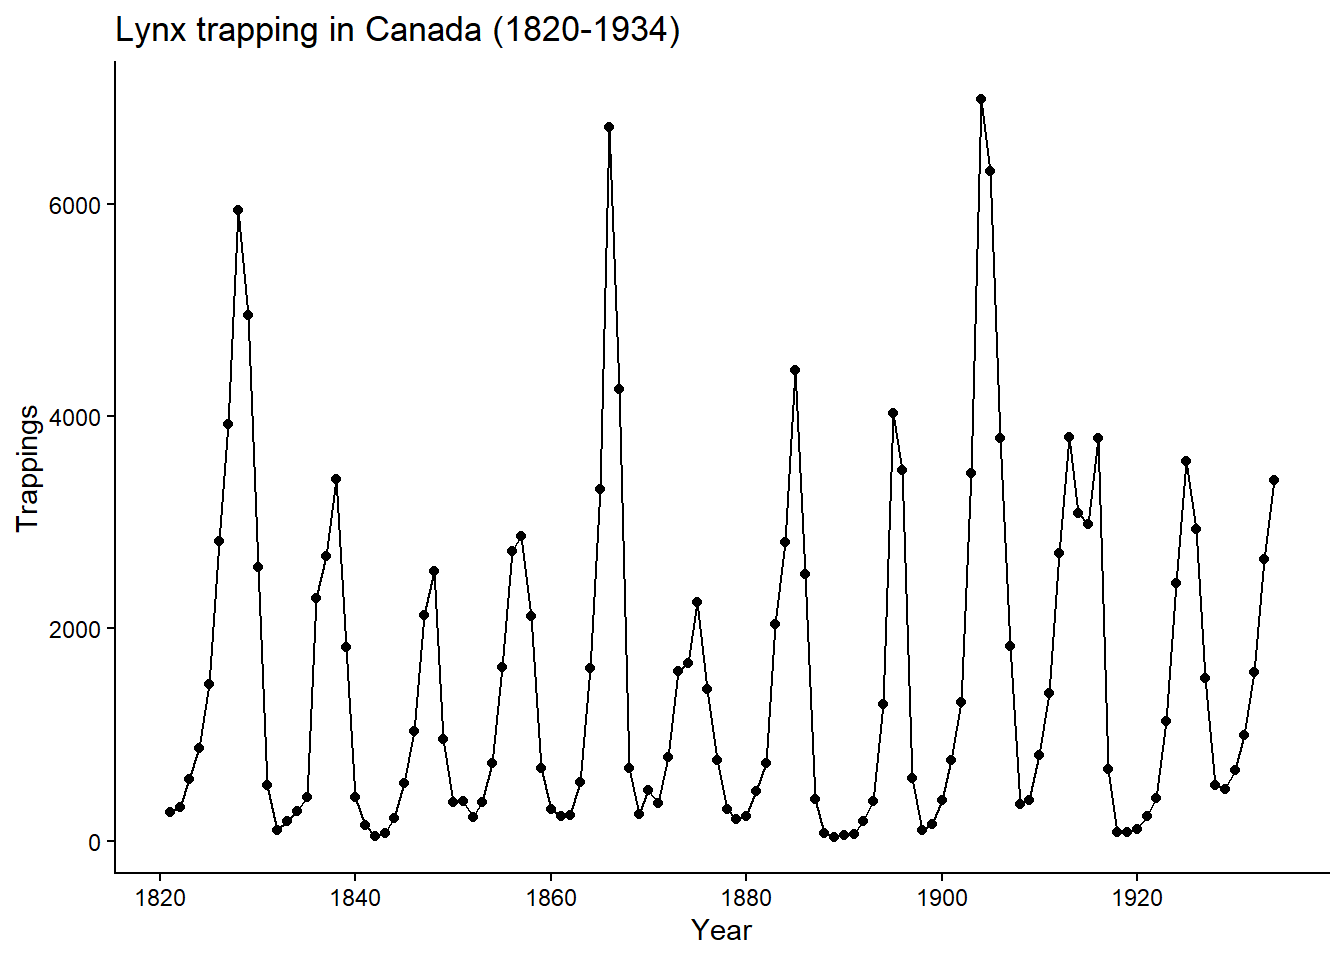
We will examine these plots using the dataset lynx, which consists of the number of Canadian lynx pelts sold per year between 1821 - 1934. It is a ‘classic’ dataset as it shows a cyclical ‘boom-and-bust’ lynx population (demonstrating predator-prey interactions).
First, we will create a variable Year.
str(lynx) Time-Series [1:114] from 1821 to 1934: 269 321 585 871 1475 ...str(lynx)
lynx_df <- as.data.frame(lynx)
str(lynx_df)
lynx_df$Year <- seq(from=1821, to=1934, by=1)
lynx_df$Trappings <- as.numeric(lynx_df$x) # Time-Series is complicated.
str(lynx_df)
head(lynx_df, 2) In R, we use functions to perform actions on objects. Functions have arguments, taking the form functionName(arg1=..., arg2=...). If you do not name the arguments, the function will assume that you are listing the arguments in order. See the help file for a function with ? to see the argument order (e.g., ?seq).
Q. 1.5
Using
seq(), write a piece of code which generates odd numbers between 1 and 20. Try with and without naming the arguments.
Q. 1.6
Using
ggplot(), produce a line plot similar to Figure 1.5.
TipView solution
ggplot(lynx_df, aes(Year, Trappings)) +
  geom_point() +
  geom_line() +
  labs(title="Lynx trapping in Canada (1820-1934)")
In base R, use plot(y ~ x, data=dataframe, type='b') to make plots with both points and lines, or type='l' for just lines.
Q. 1.7
Create a plot that shows the log-transformed number of trappings from only 1850 to 1900.
TipView solution
Alternatively (and better, in this case) is to modify the axis rather than the variable.
ggplot(lynx_df[lynx_df$Year >= 1850 & lynx_df$Year <= 1900, ],
       aes(Year, Trappings)) +
  geom_point() +
  geom_line() +
  scale_y_log10() +
  guides(y="axis_logticks") +
  labs(title="Lynx trapping in Canada (1850-1900)")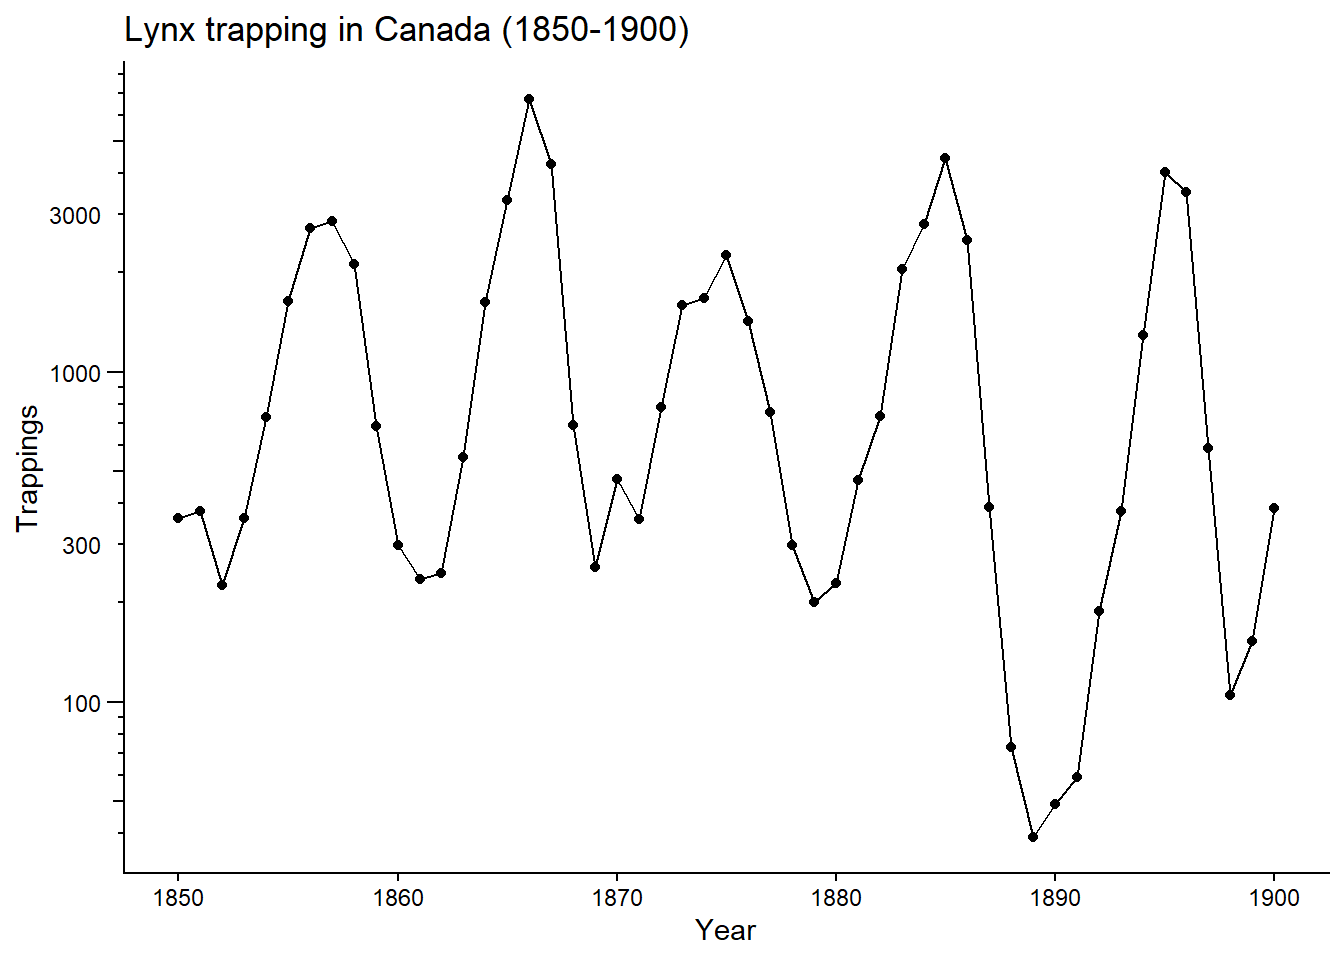
1.3.4 Histograms
Histograms illustrate the distribution of continuous data. In histograms the bars are adjacent (no gap). This indicates that the underlying values are continuous rather than discrete.
ggplot(lynx_df, aes(Trappings)) + # specify x-axis, bun not y-axis
  geom_histogram(colour="grey30", fill="grey90") +
  labs(x="Trapped lynx per year",
       title="Lynx trapping")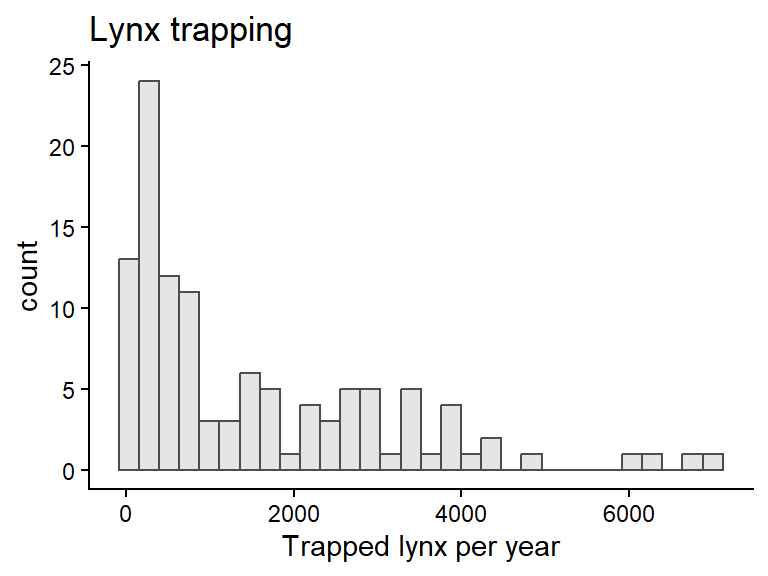
Q. 1.8
What conclusions do you draw from this plot? Which range of values was most common across years?
Be aware that histograms can be quite sensitive to the number of bins, and you should explore different options. You can set the number of bins with bins=... or specific values of break points with breaks=....
To make a multi-panel figure with ggplot, use the plot_grid() function in the cowplot package.
library(cowplot)
pA <- ggplot(lynx_df, aes(Trappings)) +
  geom_histogram(colour="grey30", fill="grey90",
                 bins=5) +
  labs(x="Trapped lynx per year",
       title="Lynx trapping")
pB <- ggplot(lynx_df, aes(Trappings)) +
  geom_histogram(colour="grey30", fill="grey90",
                 breaks=c(0, 500, 1000, 2000, 5000, 10000)) +
  labs(x="Trapped lynx per year",
       title="Lynx trapping")
plot_grid(pA, pB, nrow=1, labels="AUTO")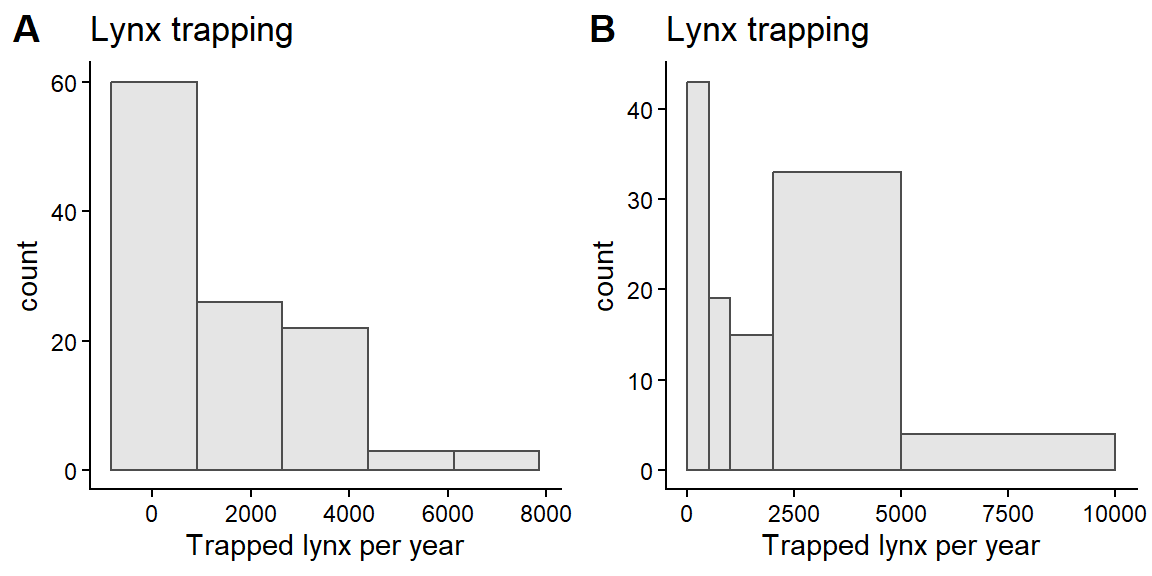
Code (bonus)
pA <- ggplot(lynx_df, aes(Trappings)) +
  geom_histogram(colour="grey30", fill="grey90",
                 breaks=seq(0, 10000, by=100)) +
  labs(x="Trapped lynx per year")
pB <- ggplot(lynx_df, aes(Trappings)) +
  geom_histogram(colour="grey30", fill="grey90",
                 breaks=seq(0, 10000, by=500)) +
  labs(x="Trapped lynx per year")
pC <- ggplot(lynx_df, aes(Trappings)) +
  geom_histogram(colour="grey30", fill="grey90",
                 breaks=seq(0, 10000, by=1000)) +
  labs(x="Trapped lynx per year")
pD <- ggplot(lynx_df, aes(Trappings)) +
  geom_histogram(colour="grey30", fill="grey90",
                 breaks=seq(0, 10000, by=2000)) +
  labs(x="Trapped lynx per year")
plot_grid(pA, pB, pC, pD, nrow=2, ncol=2,
          align="hv", axis="tblr", labels="AUTO")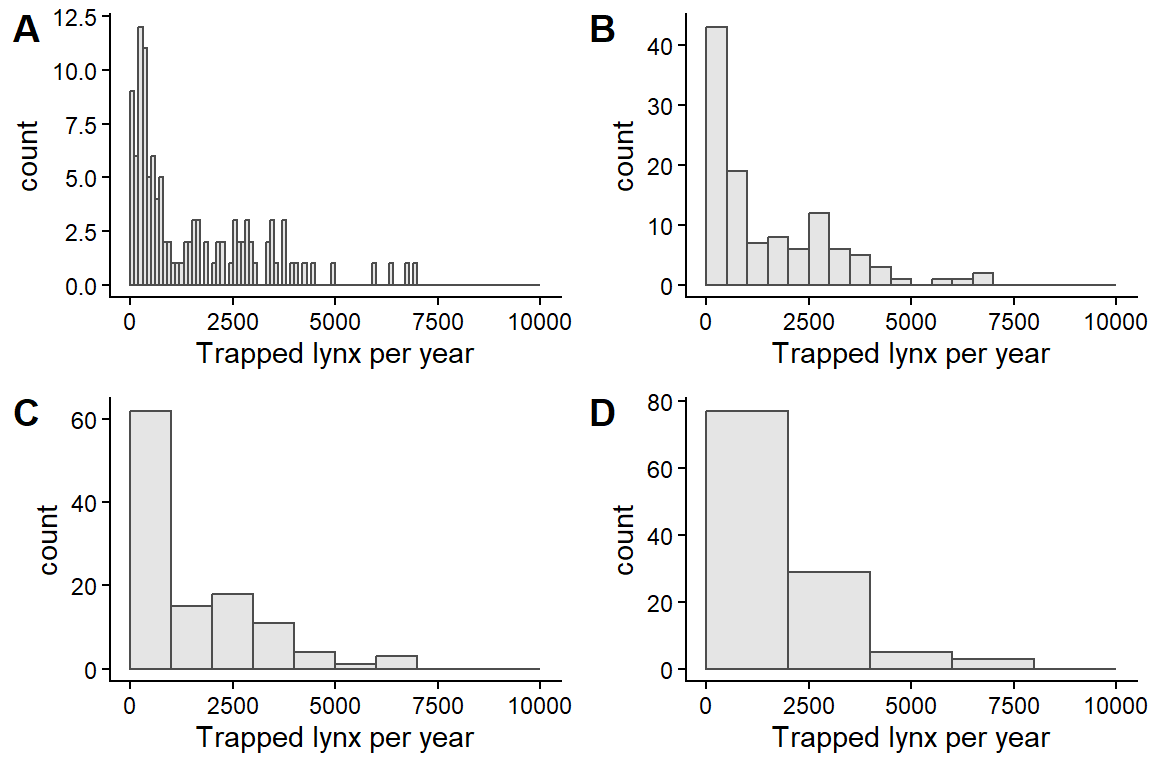
Which of these plots is the most useful? There is no definitive answer, but the first is very busy and the last fails to show relevant detail near 0. Bin widths of 500-1000 communicate the patterns most clearly.
Generally, 5-15 breaks usually work well.
In base R, use hist(dataframe$column).
1.3.5 Bar graphs
Bar graphs are used to plot counts of categorical or discrete variables. We’ll be using the islands dataset which is a named vector of island areas.
Many objects in R can have row names. However, converting between data types may lose this information. Consequently, it is better practice to store relevant information in a column. Nevertheless, there are occasions where this is useful and you may come across datasets with data stored as row names.
Working with data involves a lot of time spent tidying the datasets: cleaning, checking, and reshaping into useful formats. We will cover a more modern set of methods for this later in the course using the tidyverse package. For now, we’ll stay with base R. First, we need to tidy the islands data.
str(islands) # this is a named numeric vector
head(islands)

# convert to a dataframe
islands_df <- as.data.frame(islands)
head(islands_df, 2)
str(islands_df) # rownames are not shown! islands LandMass
Africa 11506 Africa
Antarctica 5500 Antarctica Area LandMass
1 11506 Africa
2 5500 AntarcticaAn initial attempt at a barplot makes a terrible figure.
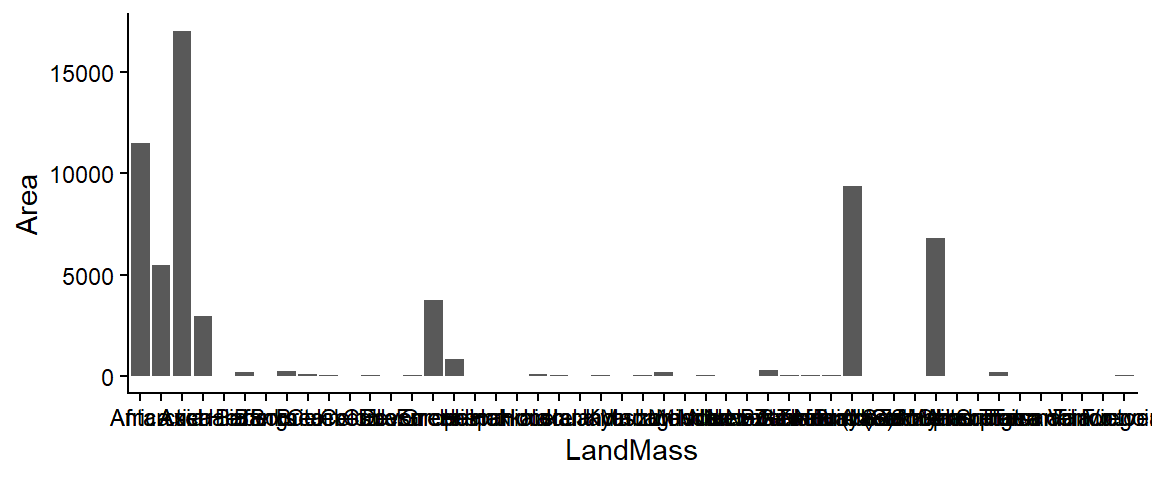
The whole dataset includes a lot of very small areas, so let’s cut it down to just the 10 largest. We also want to order the land masses by area in our plot.
We will use the arrange() function to order our dataframe, and then use scale_x_discrete() to specify the breaks in the desired order.
ggplot(islands_df[1:10,], aes(LandMass, Area)) +
  geom_bar(stat="identity") +
  scale_x_discrete(limits=islands_df$LandMass[1:10])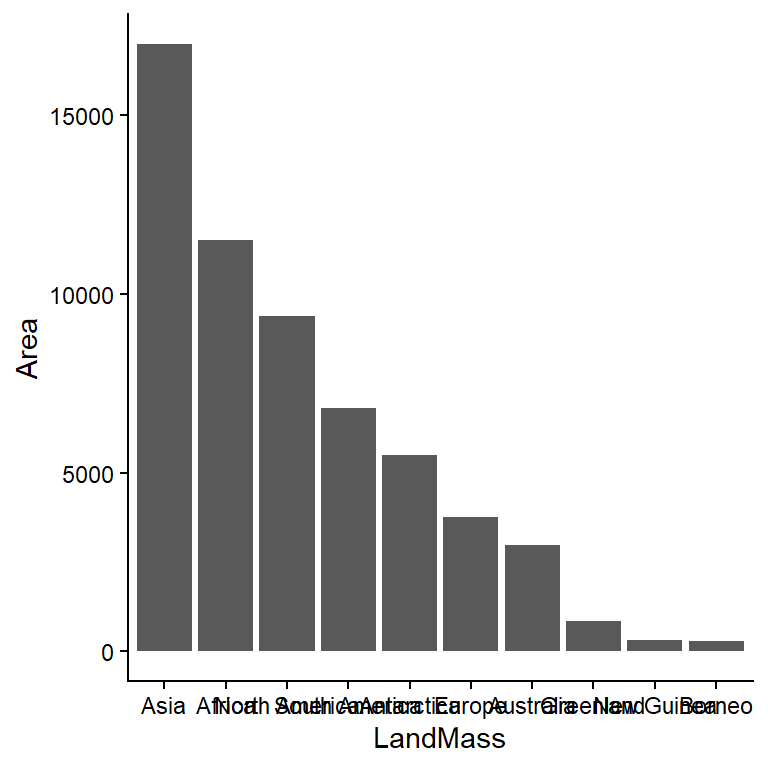
It would be more effective sideways:
ggplot(islands_df[1:10,], aes(Area, LandMass)) +
  geom_bar(stat="identity") +
  scale_y_discrete(limits=islands_df$LandMass[10:1]) +
  labs(x="Land mass",
       y="Area (km^2)")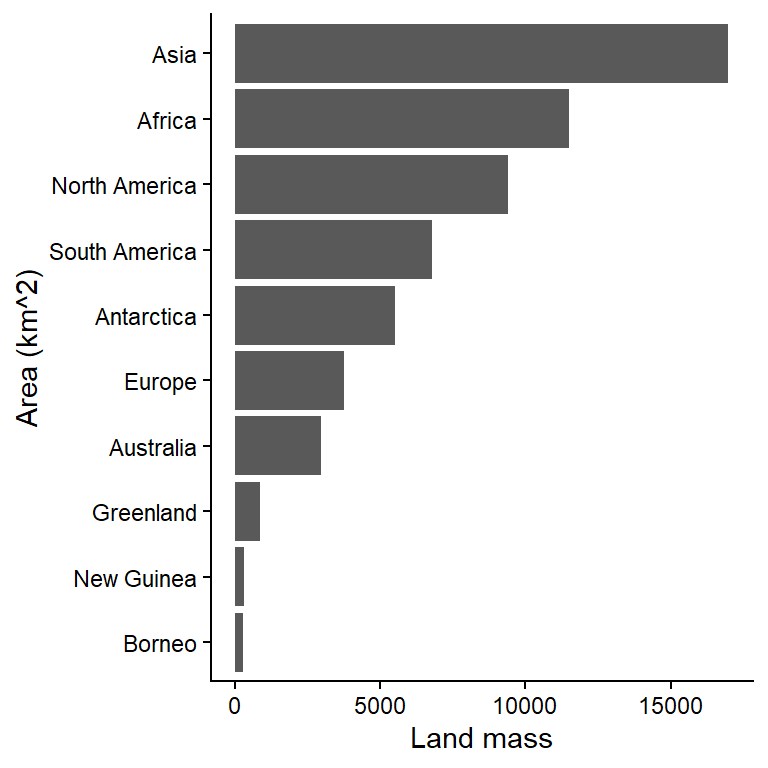
Data visualization is an iterative process with lots of trial and error to find a plot that communicates the message within the data well.
1.4 Summary statistics
You will often need to summarise your data before you present it. Data summaries are usually contained in tables and they can sometimes replace graphics (e.g., where the data is relatively simple or where individual precise values are important). There are many types of summary statistics. Here we are concerned with central tendency and variability.
Q. 1.9
What are the three main measures of central tendency?
Q. 1.10
What are three measures of variability?
The most appropriate metrics of central tendency or variability will depend on your data. Another summary statistic that you might include is sample size. R is very good at producing summary statistics, and there are myriad ways to produce them.
Often you’ll wish to summarise your data across levels of a certain factor, such as levels of a certain treatment. More complex summaries can be made using the dplyr package. We’ll go into more detail later on some of the very powerful ways this package (and others in the tidyverse) can be used.
We’ll use the built-in dataset InsectSprays. Viewing your raw data can be an important check as well. You can open a spreadsheet-style viewer in R using View(YourDataFrame) or by clicking on the icon in the Environment pane.
str(InsectSprays)'data.frame': 72 obs. of 2 variables:
$ count: num 10 7 20 14 14 12 10 23 17 20 ...
$ spray: Factor w/ 6 levels "A","B","C","D",..: 1 1 1 1 1 1 1 1 1 1 ...To do more complex summaries, we will string together a series of functions. This can be done in a nested format (e.g., fun3(fun2(fun1(dataset)))), but this gets unwieldy very quickly.
So, let’s use the pipe operator |>. This takes the output from one function and feeds it as the first input of the next (e.g., dataset |> fun1() |> fun2() |> fun3()), making code much more legible. Many functions in the tidyverse are built for piping.
?`|>`# A tibble: 6 × 8
spray mean median max sd N N_over_10 Pr_over_5
<fct> <dbl> <dbl> <dbl> <dbl> <int> <int> <dbl>
1 A 14.5 14 23 4.72 12 9 1
2 B 15.3 16.5 21 4.27 12 11 1
3 C 2.08 1.5 7 1.98 12 0 0.0833
4 D 4.92 5 12 2.5 12 1 0.167
5 E 3.5 3 6 1.73 12 0 0.167
6 F 16.7 15 26 6.21 12 10 1 1.4.1 Choosing a central tendency metric
The choice of central tendency metric depends on the nature of the data and objectives of your research. We will use datasets that you downloaded from Brightspace (Practicals > data). Remember to put these into the data folder in your working directory (or modify the file paths in the code accordingly).
# this will load the 'Scallop %fat' data sheet from the xlsx spreadsheet.
scallop_df <- read_excel("data/H2SMS_practicalData.xlsx", sheet="Scallop %fat")
str(scallop_df)
tibble [49 × 1] (S3: tbl_df/tbl/data.frame)
$ Scallop % fat: num [1:49] 22.5 24.1 18.2 32.5 17.4 23.6 21.5 22.2 27.6 22.2 ...# avoid spaces and symbols in column names. It's a pain.
names(scallop_df) <- "fat_pct"Q. 1.11
Check the data using the methods above. Does it look OK to you?
Q. 1.12
Are these data likely to be continuous or discontinuous?
Q. 1.13
Create a plot to visualize the distribution of these data.
Q. 1.14
Do you spot any issues?
TipView solution
ggplot(scallop_df, aes(fat_pct)) +
  geom_histogram(bins=15)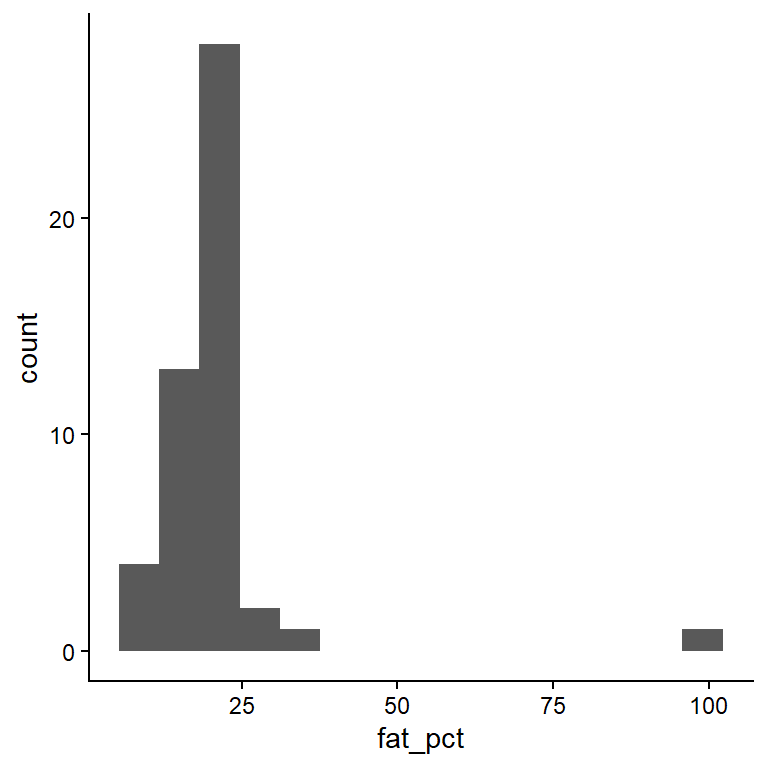
You should have spotted a potential outlier. Data entry errors are common, and a check against the original data sheet shows that the decimal was typed in the wrong place. The following code helps you locate the error.
which(scallop_df$fat_pct > 50) # which() returns the indexes[1] 36scallop_df$fat_pct[35:37] # row 36 is 99.0, but should be 9.90[1] 22.8 99.0 12.9# A tibble: 2 × 2
fat_pct_orig fat_pct_corr
<dbl> <dbl>
1 22.5 22.5
2 24.1 24.1# there are many ways to 'fix' the outlier in R.
# You need to correct the outlier in row 36 of column 'fat_pct_corr'
scallop_df$fat_pct_corr[36] <- 9.9
which(scallop_df$fat_pct_corr > 90)
# integer(0) - this means that no elements in fat_pct_corr contain values >90Now summarise scallop_df using some of the methods above.
Q. 1.15
Create a histogram for the corrected column. How does it differ from the original column with the error?
Q. 1.16
Calculate mean, variance, median, interquartile range, minimum, maximum and range for both fat_pct_orig and fat_pct_corr.
Q. 1.17
Suppose the outlier was even bigger (i.e. your typo was even worse). Adjust your data, multiplying the erroneous data item by 10; copy the fat_pct_orig column and change row 36 to 999.
Q. 1.18
Calculate the same summary statistics.
Q. 1.19
Which measures of central tendency and variability are most ‘robust’ against this outlier?
Or look individually instead of calculating many metrics at once with tidyverse functions:
summary(scallop_df$fat_pct_corr) Min. 1st Qu. Median Mean 3rd Qu. Max.
8.50 16.90 20.60 19.56 22.50 32.50 var(scallop_df$fat_pct_corr)[1] 22.79836IQR(scallop_df$fat_pct_corr)[1] 5.6R is excellent at generating well formatted tables such as shown in Table 1.1. What is missing from from this table?
| Column | Mean | Median | Standard deviation | Range | Interquartile range |
|---|---|---|---|---|---|
| fat_pct_corr | 19.6 | 20.6 | 4.77 | 24.0 | 5.6 |
| fat_pct_orig | 21.4 | 20.6 | 12.20 | 90.5 | 5.3 |
Q. 1.20
How would the patterns seen in Table 1.1 influence your choice if you were required to summarise data that you thought might contain values that could be erroneous? Consider how each metric is influenced by the data distribution and by outliers.
Let’s load a dataset that gives the length of hake across three years of sampling.
hake_df <- read_excel("data/H2SMS_practicalData.xlsx", sheet="Hake")
str(hake_df) # once again, column names made for excel rather than R
tibble [499 × 2] (S3: tbl_df/tbl/data.frame)
$ Year : num [1:499] 1 1 1 1 1 1 1 1 1 1 ...
$ Hake length (mm): num [1:499] 190 219 181 148 206 204 168 197 178 211 ...Q. 1.21
What type of variable is length?
Q. 1.22
Select an appropriate graphical method and display these data.
Hint: ggplot(..., aes(..., group=Year)) + geom_boxplot()
Q. 1.23
In your own time, summarise the hake data by year using the tidyverse functions you used above with the InsectSprays data.
| Year | Mean length (cm) |
|---|---|
| 1 | 201.8 |
| 2 | 497.0 |
| 3 | 988.9 |
The following ‘settling velocity’ data relates to the settling velocity of salmon faecal material. Shona Magill generated these data.
fishPoo_df <- read_excel("data/H2SMS_practicalData.xlsx", sheet="Settling velocity")
str(fishPoo_df)
tibble [200 × 1] (S3: tbl_df/tbl/data.frame)
$ Settling velocity (mm s-1): num [1:200] 2.06 1.03 1.56 1.88 1.16 0.76 1.26 1.13 1.23 1.31 ...Q. 1.24
Produce a histogram of the settling velocity. Is it left or right skewed?
Q. 1.25
Which measures of central tendency and variability are most appropriate?
Q. 1.26
Considering the distribution, is the mean or median larger?
Q. 1.27
Generate a new column of the log-transformed settling velocity data and plot these data.
Q. 1.28
What measures of central tendency and variability could be applied to the log-transformed data? Selecting the preferable metrics for a dataset is not necessarily straightforward.
Table 1.3 gives some indication of what issues you might consider.
| Data distribution | Central tendency metric | Variability metric |
|---|---|---|
| Continuous, unimodal, symmetric | Mean | Variance or sd |
| Continuous, skewed | Median | Interquartile range |
| Continuous, multimodal | None; state modes | None; summarise by group |
| Discontinuous | None; data-dependent | Range? |
1.5 Conclusions
Visualizing and summarising data are the critical first steps in the data analysis and reporting workflow. We use graphical methods to firstly explore our own data. Once we have made sense of it we select the most appropriate method to convey that understanding to our readers. We may help that communication by summarising data in the most appropriate way taking into account the distribution of the data and the presence of outliers.